Sales Reports in Webgility Analytics
This article provides an overview on Sales Reports to Webgility Analytics users, which allow to track and analyze sales across all connected channels. Reports include real-time and historical KPIs, charts, pivot tables, insights, and AI-driven forecasts. Users can filter data by sales channel, product, currency, order status, fulfillment method, and date range to monitor performance, compare periods, and identify top-selling products and channels.
A comprehensive overview of Sales Reports in Webgility Analytics
This report shows sales and orders by channel and product in addition to comparison and forecast reports across connected sales channels. Customers can filter specific date ranges or drill down on a particular sales channel for deeper analysis.
Data is updated twice daily and displayed in Pacific Time (PT) and USD. For a new user or new connection, the data takes one day to populate the report in any view.
To access this report, open the Analytics tab and select Sales.
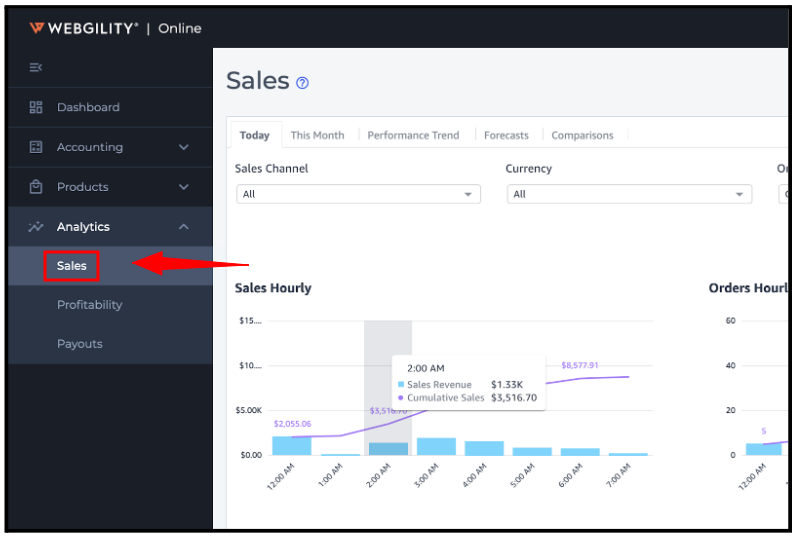
The Sales tab features several views:
-
Today
-
This month
-
Performance trends
-
Forecast
-
Comparisons
Today
The Today view contains sales for the current date. This view updates approximately every 30 minutes to 1 hour with data from all your connected sales channels.
It captures and displays the most relevant information as it's happening across your business. “Last Updated (PST)” indicates the most recent data refresh.
Filter the Today view by sales channel, currency, and order status.
-
Sales channel: Select this filter to see data for a particular sales channel. This filter defaults all connected channels.
-
Currency: Select this filter to see currency for channels that support multiple currencies. Note: This filter doesn’t change the display currency. It will still show all values in USD, but the amounts will reflect the currency filter you apply.
-
Order status: Select this filter to specify the order statuses you want to include in your graphs. This filter defaults to all Open and Completed orders. Open orders are new but not shipped. Completed orders include all shipped orders.
The Today view displays the following:
-
KPIs
-
Charts
-
Pivot table
-
Insights
KPIs
-
Sales: The total sales generated today.
-
Orders: Total orders for today.
-
Average order value (AOV): Total sales divided by the number of orders.
You can export KPI data as a CSV or Excel file.
Charts
Sales hourly: This graph shows your sales every hour with a trend line showing cumulative sales for the day.
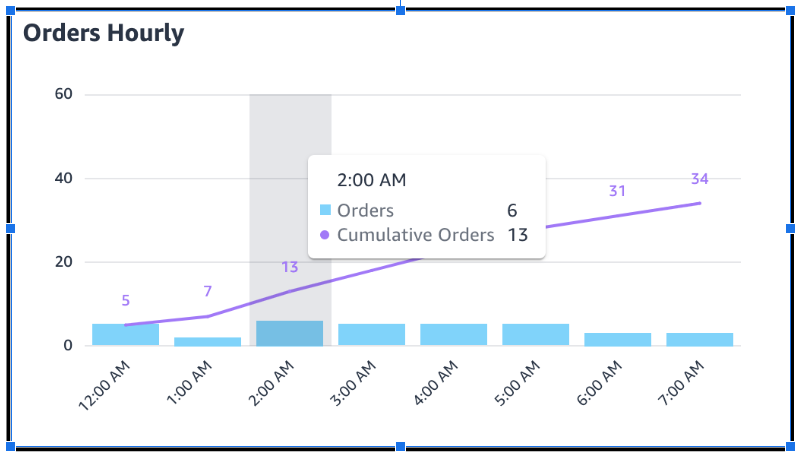
Orders hourly: This graph shows your order volume every hour with a trend line showing cumulative orders for the day.
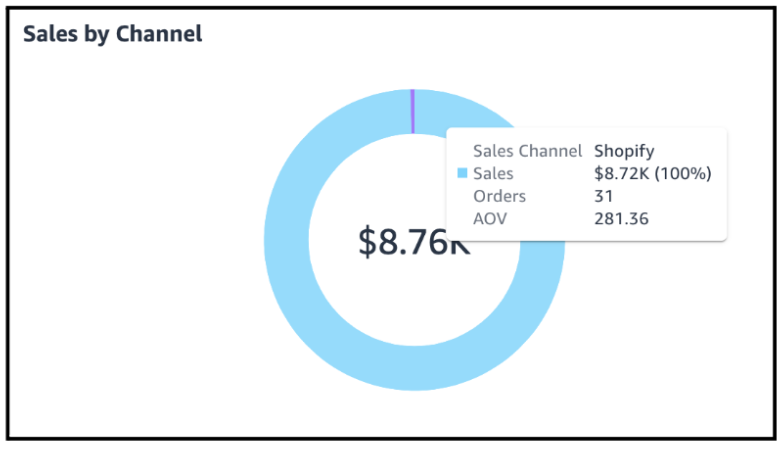
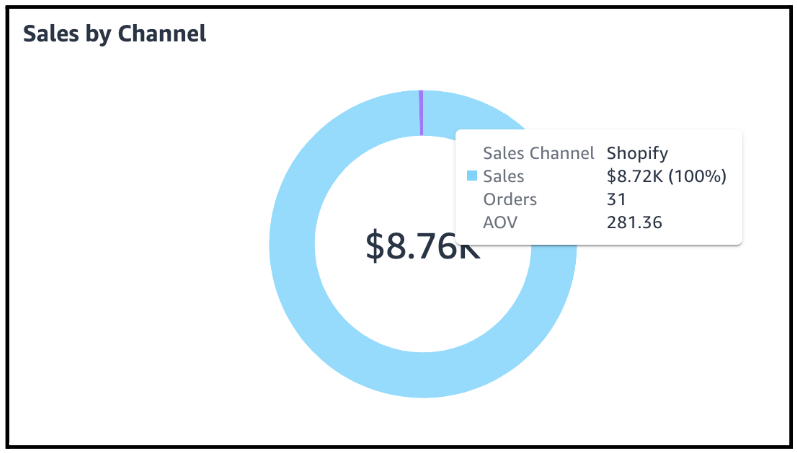
Sales by channel: This graph breaks down sales by each channel. Hover over the context menu to drill down on sub-channels.
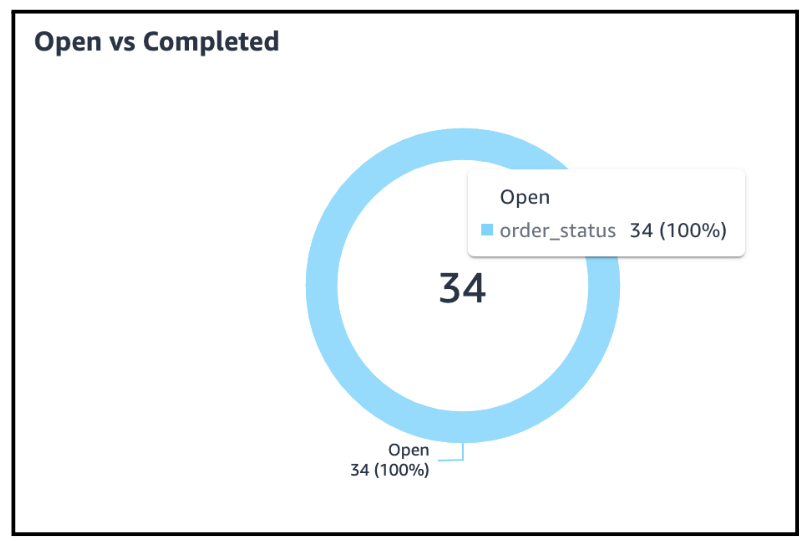
Open vs. completed orders: This graph shows a breakdown of orders by status.
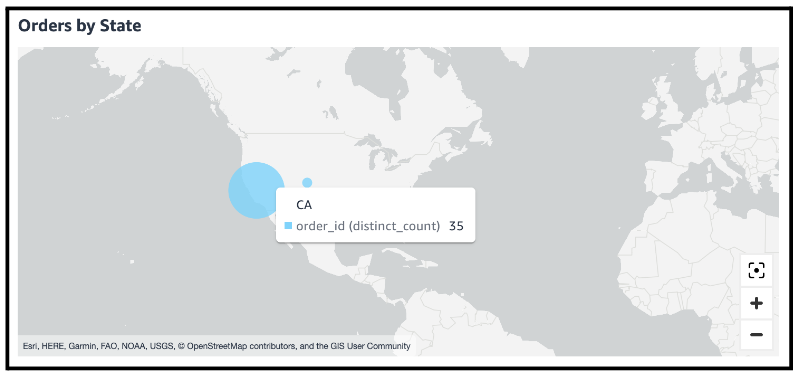
Orders by state: Explore a map of where all your orders were placed. Hover over an area for more details.
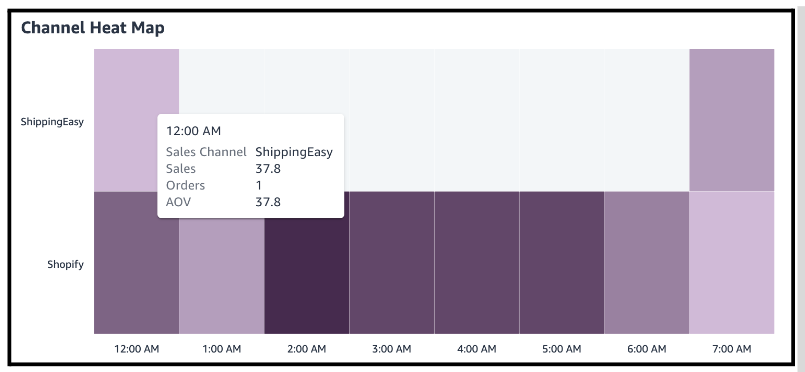
Channel heat map: This heat map displays sales and order volumes by hour across all your connected sales channels. Hover over an area to see more details.
Pivot table
-
Orders by status: This pivot table shows a breakdown of each channel with order counts for each status.
Insights
-
Top 10 products sold by sales: A list of top products by total sales.
-
Top 10 products sold by quantity: A list of top products by total quantity.
This month
The Month view contains sales for the current month. This view updates with data from all your connected sales channels every 6-8 hours.
It captures and displays the most relevant information as it's happening across your business. The filters for the Month view are the same as the Today view.
The Month view displays the following:
-
KPIs
-
Charts
-
Pivot table
-
Insights
KPIs
-
Sales: The total sales generated for the month.
-
Orders: Total orders for the month.
-
Average order value (AOV): Total sales divided by the number of orders.
You can export KPI data as a CSV or Excel file.
Charts
-
Sales daily: This graph shows your daily sales with a trend line showing cumulative sales for the month.
-
Orders daily: This graph shows your daily order volume with a trend line showing cumulative monthly orders.
-
Sales by channel: This graph shows sales broken down by each channel. Hover over the context menu to drill down on sub-channels.
-
Open vs. completed orders: This graph shows a breakdown of orders grouped by status.
-
Orders by state: Explore a map of where all your orders were placed. Hover over an area to see details.
-
Channel heat map: This heat map shows sales and order volumes by the hour across all your connected sales channels. Hover over an area to see more details.
Pivot table
-
Orders by status: This pivot table shows a breakdown of each channel with order counts for each status.
Insights
-
Top 10 products sold by sales: A list of top products by total sales.
-
Top 10 products sold by quantity: A list of top products by total quantity.
Performance trends
Performance trends data is updated daily from all your connected sales channels. Use this view to see long-term trends in your gross sales and orders. Review trends for any particular sales channel, or product.
Filter performance trends by sales channel, product, currency, and date range.
-
Sales channel: Select this filter to see data for a particular sales channel. The default view includes all connected sales channels.
-
Product: Select this filter to see data for one or more products. The filter defaults all products.
-
Currency: Select this filter to see currency for channels that support multiple currencies. Note: This filter doesn’t change the display currency. It will still show all values in USD, but the amounts will reflect the currency filter you apply.
-
Date range: Customize the date range for customer orders. This filter defaults to the current month.
The Performance trend view displays the following:
-
KPIs
-
Charts
KPIs
The Performance trends view captures data for the following KPIs for the date range selected.
-
Sales: The total sales generated.
-
Orders: Total orders.
-
Average order value (AOV): Total sales divided by the number of orders.
You can export KPI data as a CSV or Excel file.
Charts
-
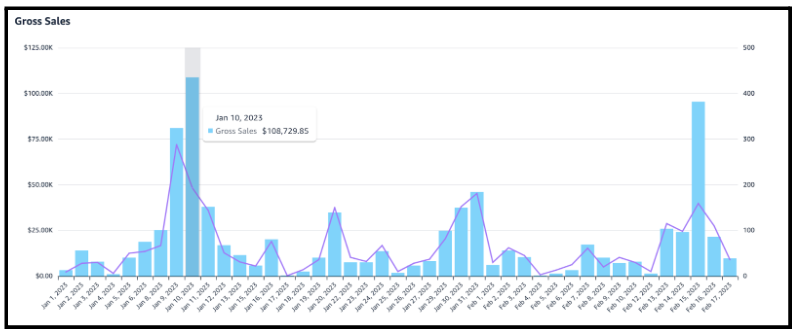
Gross sales: This shows gross sales and order trends based on the date range selected.
Gross sales: This shows gross sales and order trends based on the date range selected.
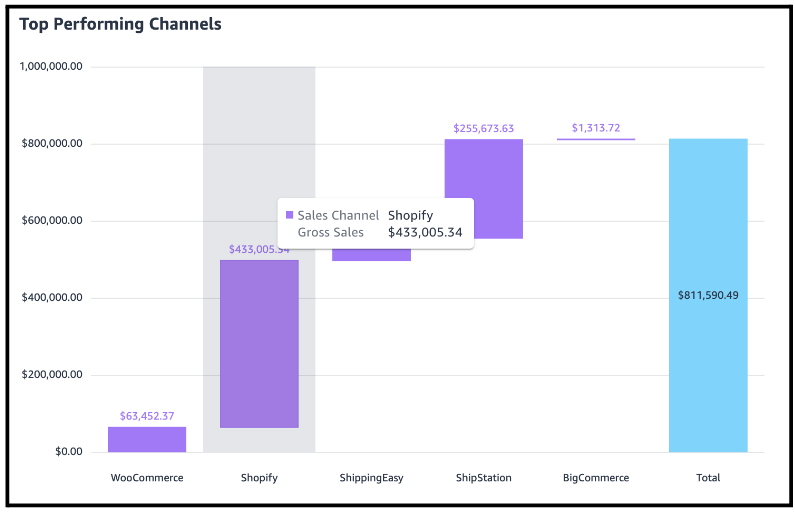
Top-performing channels: This waterfall chart shows the top-performing channels for sales.
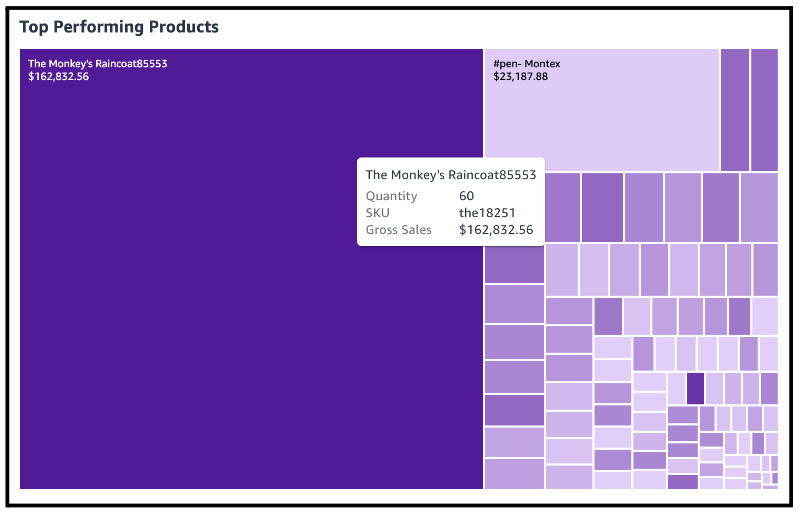
Top-performing products: This heat map shows the top-performing products for sales for the date range selected. Size represents revenue, and color represents quantity.
Forecast
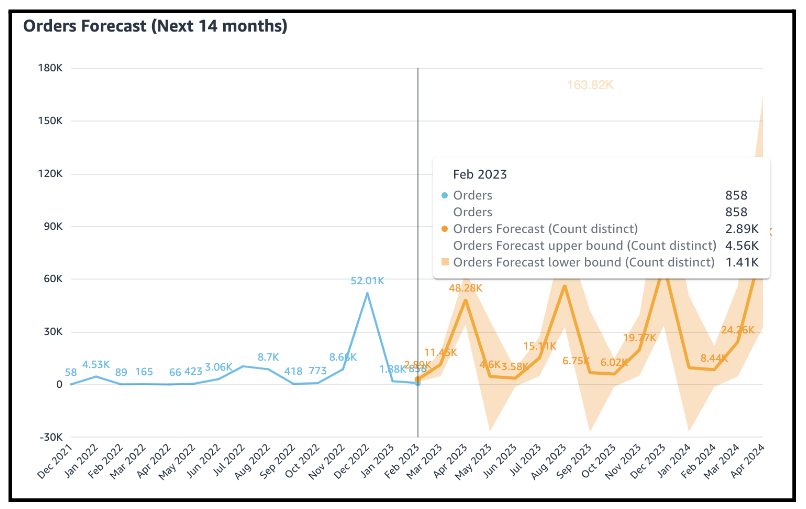
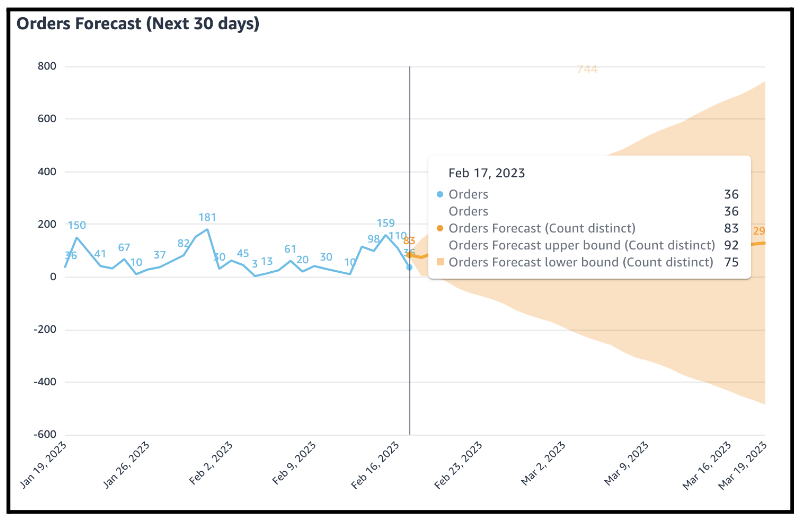
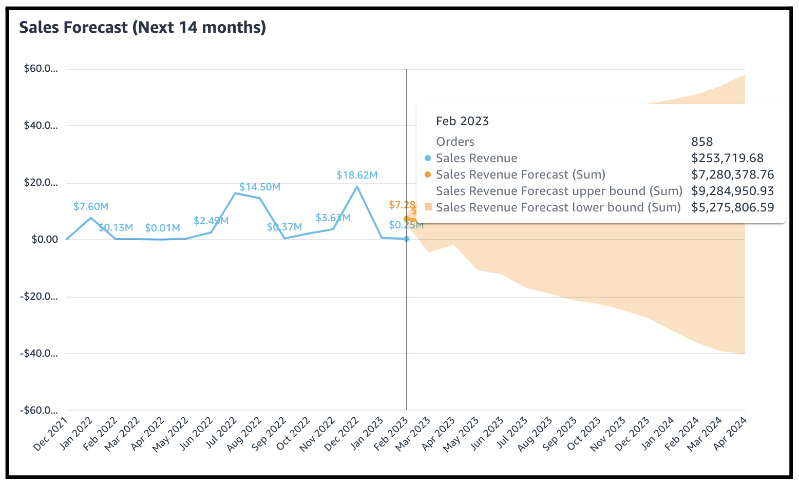
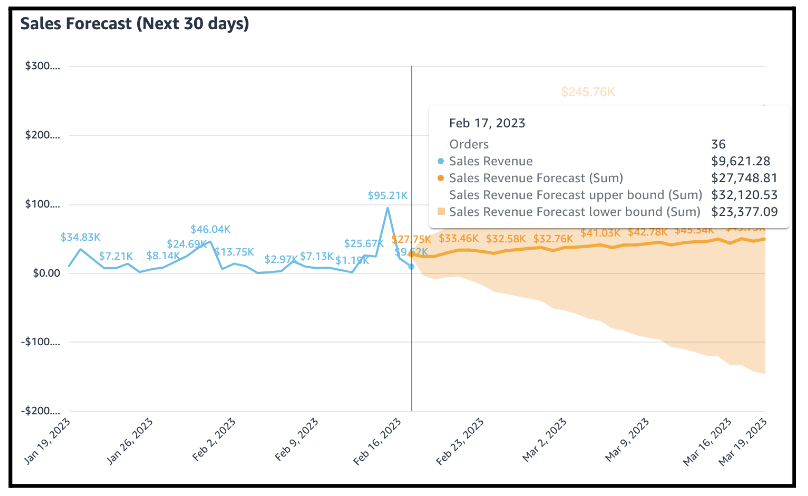
Use the Forecast view to see an AI-driven forecast of your sales and order volumes for the next 30 days and 14 months. This data is updated nightly with data from all your connected sales channels.
Webgility’s Analytics solution uses machine learning algorithms to analyze data from your sales channels to predict — and help you prepare for — future performance. Over time, forecast reports will become more accurate and reflect seasonal variations.
You can filter the Forecast view by sales channel, sub-channels, currency, order status, and fulfillment method.
-
Sales channel: Select this filter to see data for a particular sales channel. The default view includes all connected sales channels.
-
Sub-channels: Select this filter to see reports for a sub-channels. This filter defaults to all sub-channels for all channels.
-
Currency: Select this filter to see currency for channels that support multiple currencies. Note: This filter doesn’t change the display currency. It will still show all values in USD, but the amounts will reflect the currency filter you apply.
-
Order status: Select this filter to specify the order statuses you want to include in your graphs. This filter defaults to all Open and Completed orders. Open orders are new but not shipped. Completed orders include all shipped orders.
-
Fulfillment method: Select this filter to specify the fulfillment method (i.e., Amazon FBA, Amazon FBM, and non-Amazon orders).
Charts
-
Order forecasts for the next 14 months.
-
Order forecasts for the next 30 days.
-
Sales forecasts for the next 14 months.
-
Sales forecasts for the next 30 days.
Comparisons
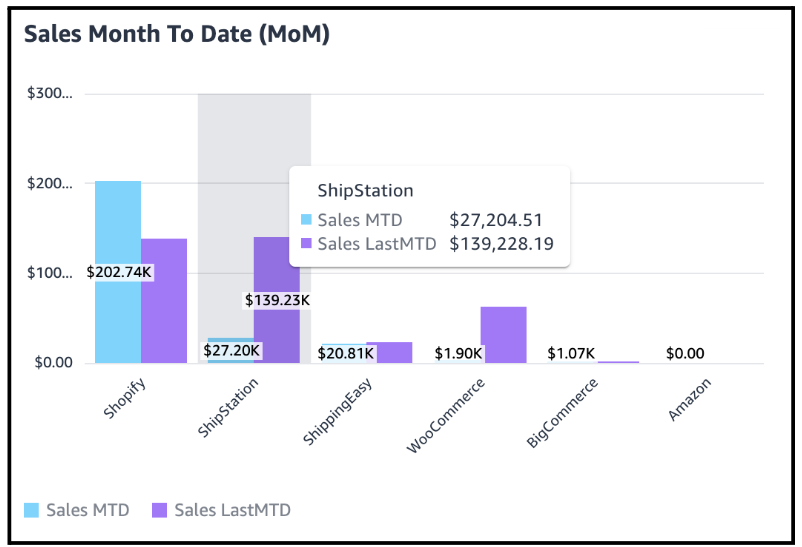
The Comparisons view compares sales performance over different periods. Comparison data is updated every 6-8 hours with data from all your connected sales channels.
You can filter the Comparisons view by sales channel, currency, order status, fulfillment method, and date range.
-
Sales channel: Select this filter to see data for a particular sales channel. The default view includes all connected sales channels.
-
Sub-channels: Select this filter to see reports for a sub-channel. This filter defaults to all sub-channels.
-
Currency: Select this filter to see currency for channels that support multiple currencies. Note: This filter doesn’t change the display currency. It will still show all values in USD, but the amounts will reflect the currency filter you apply.
-
Order status: Select this filter to specify the order statuses you want to include in your graphs. This filter defaults to all Open and Completed orders. Open orders are new but not shipped. Completed orders include all shipped orders.
-
Fulfillment method: Select this filter to specify the fulfillment method (i.e., Amazon FBA, Amazon FBM, and non-Amazon orders).
-
Date range: Customize the date range for customer orders. This filter defaults to the current month.
Charts
-
Sales month-to-date (MoM): This chart shows how your sales from this month compare to the last month.
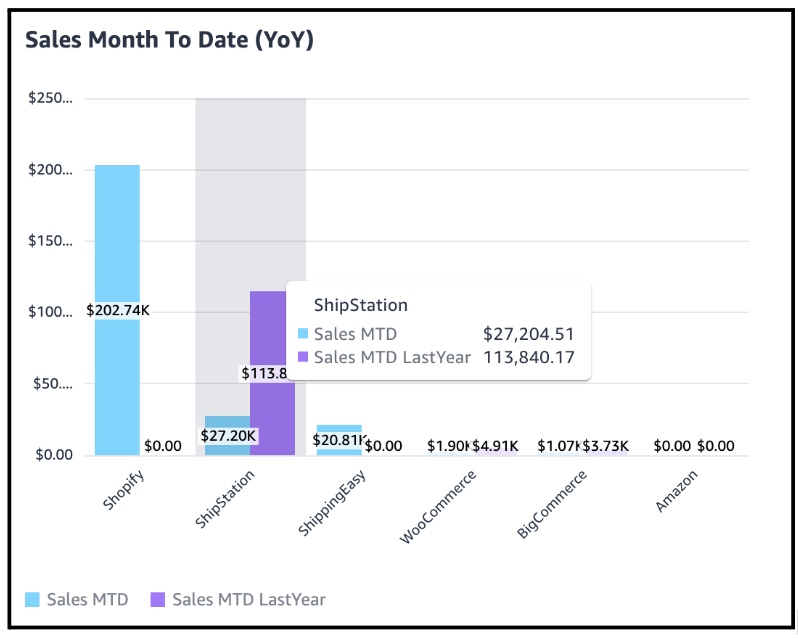
Sales month-to-date (YoY): This chart shows how your sales from this month compare to the same month from the prior year.
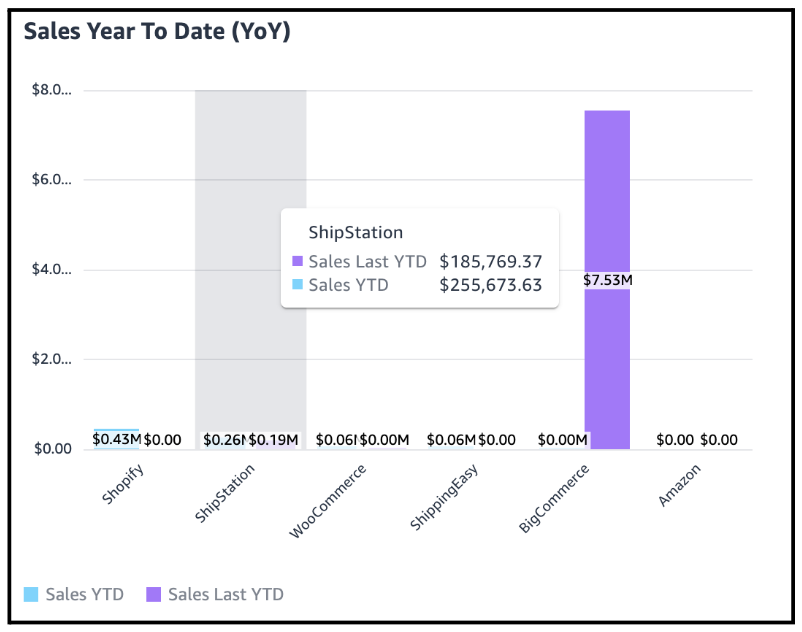
Sales Year to Date (YoY): This chart shows how your sales from this year to date compare to the same period from the prior year.
