Explore profitability across your connected sales channels with Webgility Analytics.
This report is a snapshot of profitability across your connected sales channels. Webgility syncs revenue and fee data from the sales channels and item costs and cost of goods sold (COGs*) from your accounting system.
Data is updated nightly and displayed in Pacific Time (PT).
Data may take up to one day to populate when you first access the reports or add a new connection.
To access the profitability report, open the Analytics tab and select Profitability.
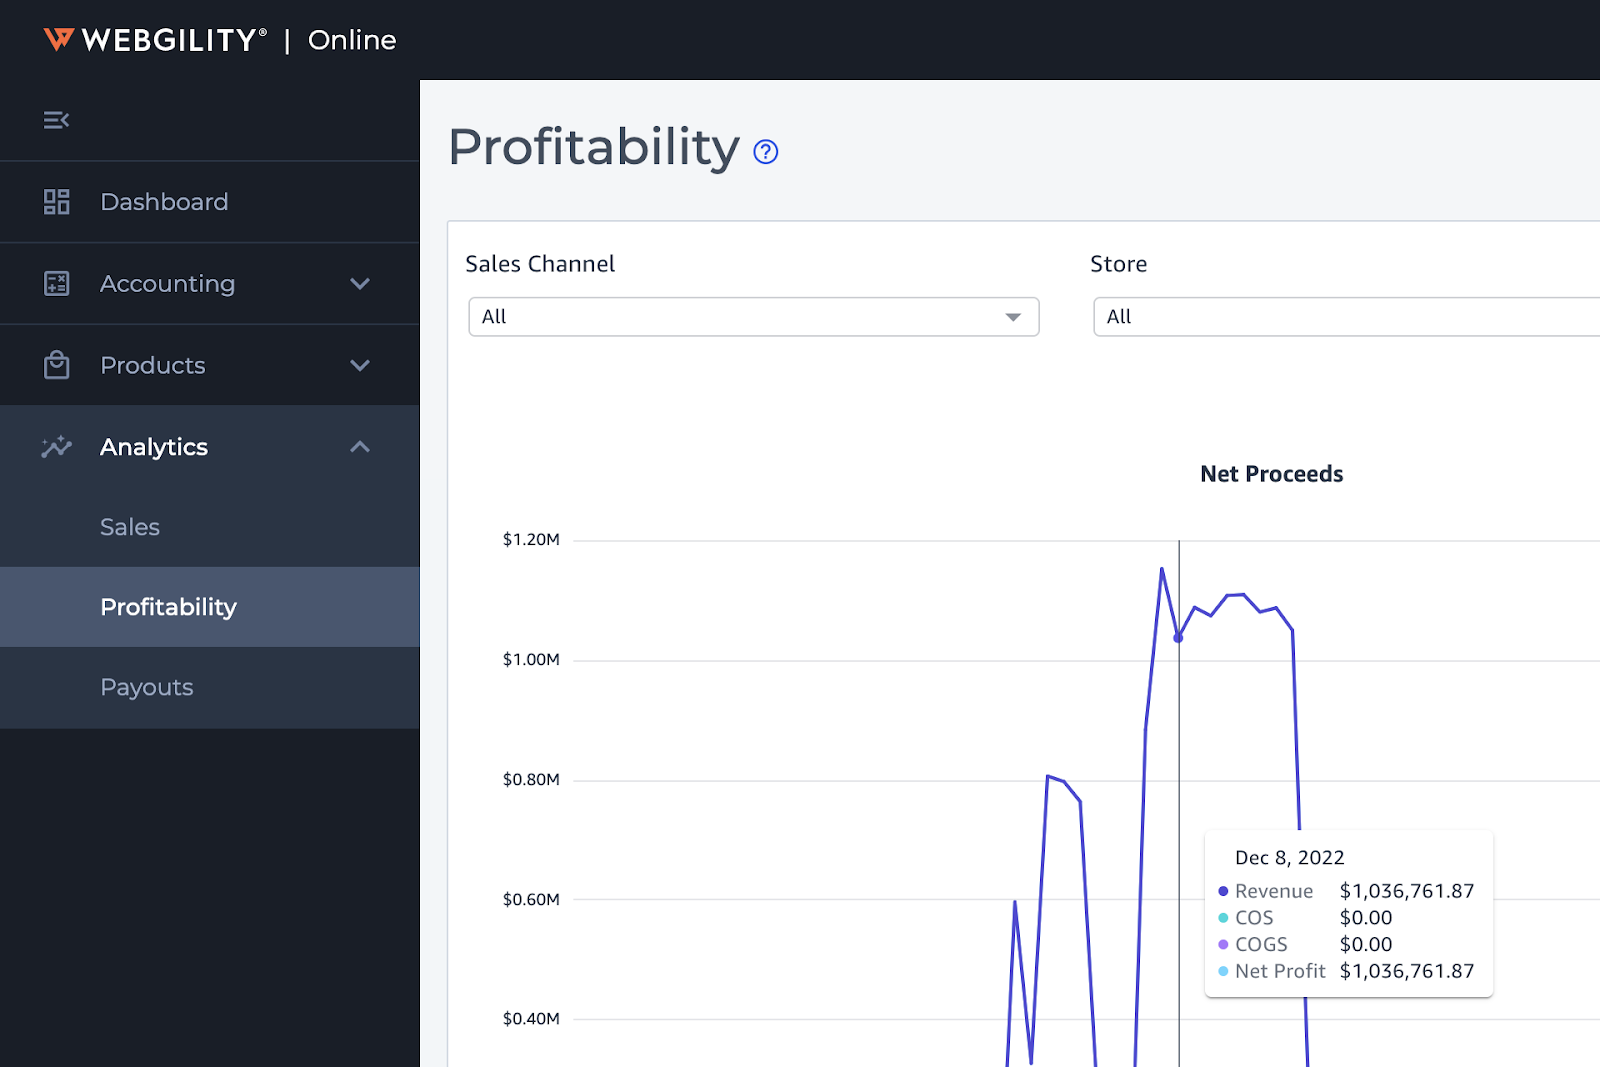
You can filter reports by sales channel, and date range.
-
Sales channel: Select this filter to see data for a particular sales channel. The default view includes all connected sales channels.
-
Date range: Customize the date range to see profitability data for any period. The default view is set to the current month.
The Profitability tab displays the following:
-
Financial snapshot
-
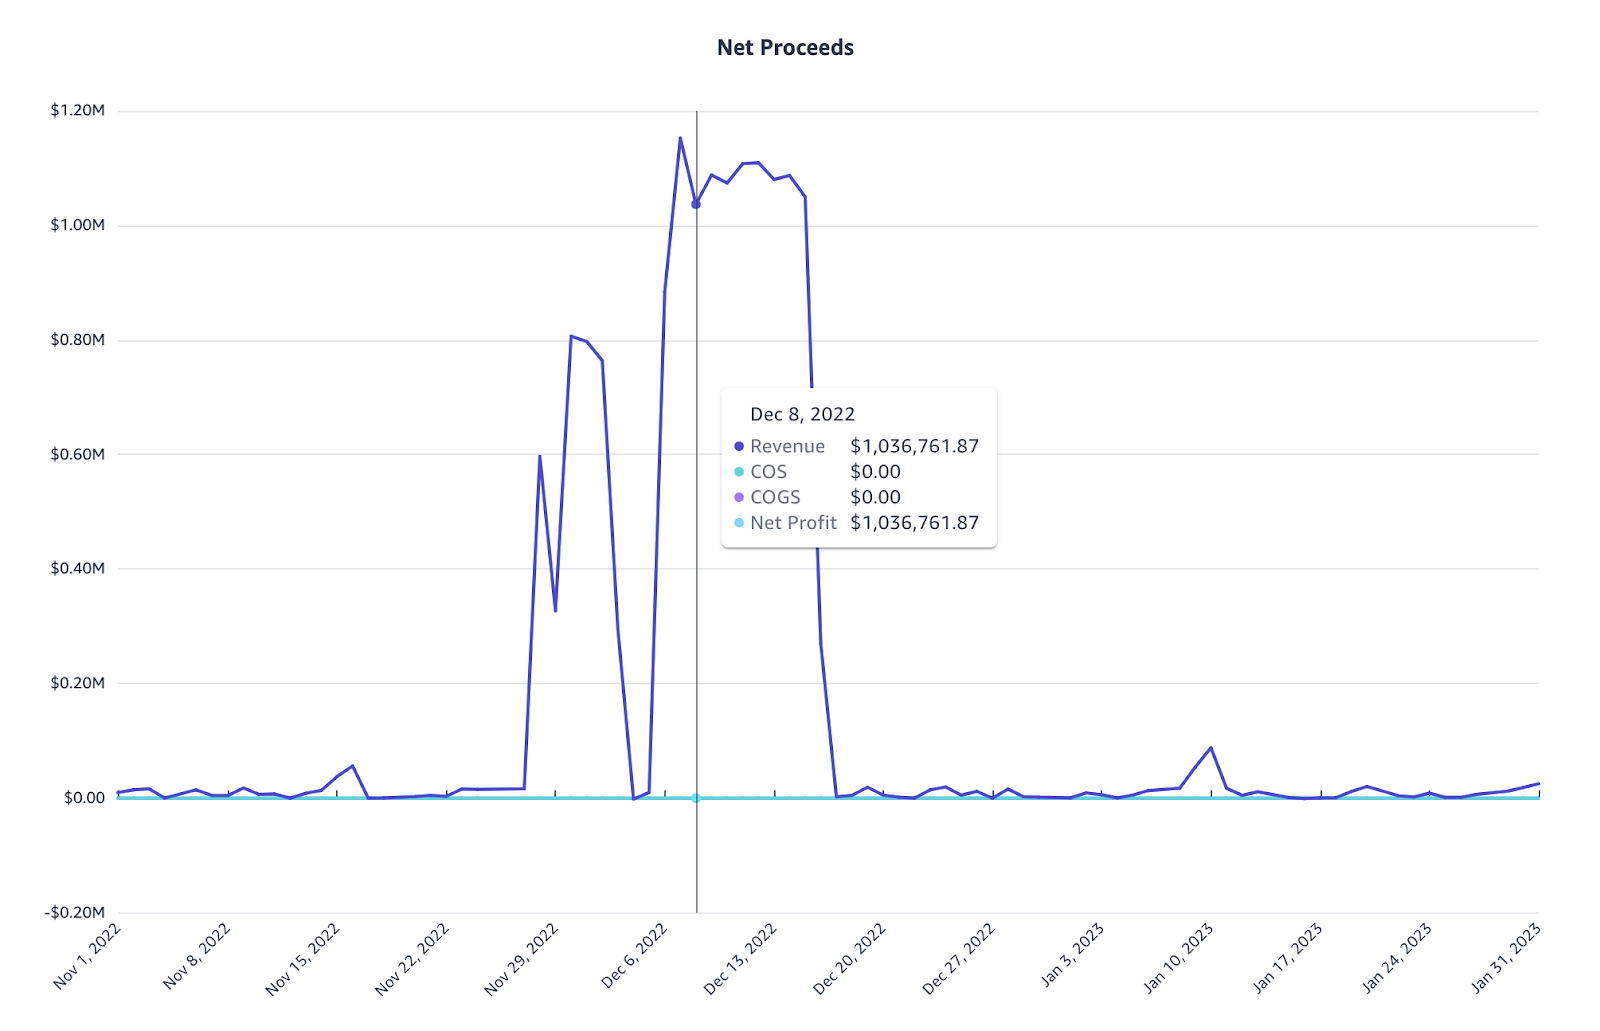
Net proceeds
-
Performance by channel
Financial snapshot
Net proceeds
Performance by channel
Financial snapshot
The financial snapshot is a pivot table of all the orders for a selected period. It displays the net profit for the selected period by showing the list of incomes and expenses. You can export this data as a CSV or Excel file.
-
Revenue: Your gross sales minus refunds.
-
Sales: Your total sales, including refunds.
-
Refunds: Total refunds given. Refunds display as negative (-) values.
-
Cost of goods sold (COGS): The cost of each item within the order. Webgility syncs costs from QuickBooks if the item has a cost value associated with it.
-
Shipping fees: The cost to ship the order obtained from your marketplace report or connected shipping app.
-
Gross profit: Your revenue minus your COGS.
-
Cost of sales (COS): All fees, including processor, selling, and advertising. Fees display as negative (-) values.
-
Processor fees: Payment processor fees charged for the order.
-
Selling fees: All associated selling fees obtained from your marketplace settlement report.
-
Advertising fees: All advertising fees obtained from your marketplace settlement reports.
-
Earnings before tax: Your gross profit minus your COS.
-
Taxes: Taxes collected from orders. Taxes display as negative (-) values, as they will be returned to the IRS.
-
Net Profit: Your earnings before tax - your taxes.
-
Net profit percent: Your net profit divided by your revenue, multiplied by 100.
You can export this data to CSV or Excel file formats.
You can export the underlying summary data of this chart to Excel or CSV file formats.
Performance by Channel
Performance by channel is a pivot table depicting the financial snapshot by sales channel. It shows the following data:
-
Revenue: Your gross sales minus refunds.
-
Cost of goods sold (COGS): The cost of each item within the order. Webgility syncs costs from QuickBooks if the item has a cost value associated with it.
-
Cost of sales (COS): All fees, including processor, selling, and advertising. Fees display as negative (-) values.
-
Net Profit: Your earnings before tax - your taxes.
*COGS not currently supported for QuickBooks Online International
*COGS is not currently supported for imports from Shopify import and manual uploads