Learn more about how you can optimize your cash flow with inventory forecasting.
You will receive a popup to set your system up with the Forecasting Feature with the following options.
-
No, Thank You: You will not see this popup again. You will need to manually set up your lead times on your SKUs at a later date if you intend to use the feature.
-
Remind Me Later: You will dismiss the popup and it will reappear the next time you log into Webgility Desktop.
-
Get Started: This will proceed with the setup wizard.
-3.jpg)
1. Once selecting Get Started, you will need to set up the lead time for your SKUs. Lead time is the amount of time it takes in days to receive a product in your inventory after ordering it from a vendor. If you select:
-
No, Skip for Now: A default lead time of 14 days is applied to all of your products. This can be edited at any time.
-
Yes, Upload File: You can import a .csv file with two columns, one with the SKU and one with the Lead Time in days.

2. From this screen, click Upload to browse for your .csv file, then click Next to add it to Webgility.

3. Webgility will analyze the file and display a list of column names with example data. You will need to find the column containing your SKUs and the column containing your Lead Time and select them from the drop-downs.
You will also be asked if this information applies to this specific Sales channel or all the sales channels you have connected to Webgility. If your SKUs are the same across all of your sales channels, then the All Sales Channels option should be selected. If your sales channels have different SKUs or different identifiers for the same items, then select Current Sales channel.
4. Once you have made the above selections, click Next.

5. The icons displayed will guide you where to find the information in Webgilty. Click OK.

6. The Inventory Summary screen displays the results of the import and the value of your Aging Inventory. Here, Aging Inventory is defined as a SKU that has not sold in 90 or more days. Select Show Details to go to the List Inventory view in the Products Module.

List Inventory View
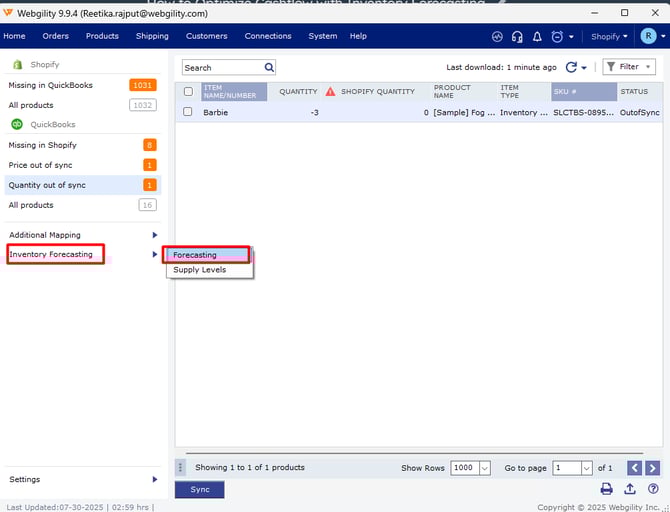
1. Now that you have set up inventory forecasting, the results will be shown in the List Inventory view. To access this view, go to Products > Inventory Forecasting > Forecasting, then click List Inventory from within the Products Module.
2. This screen shares some common elements with the other areas of the Products Module, but has new columns displaying stock levels.
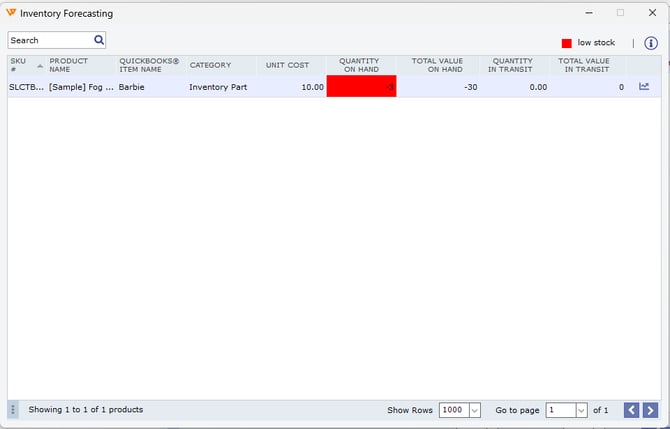
3. The columns are as follows:
-
Quantity on Hand: The total number of units of the SKU from on-hand quantity in QuickBooks.
-
Total Value on Hand: The combined value of all in-stock units based on the cost from QuickBooks.
-
Quantity in Transit: The total number of units on purchase orders.
-
Total Value in Transit: The combined value of all units, which are in purchase orders, based on costs from QuickBooks.
-
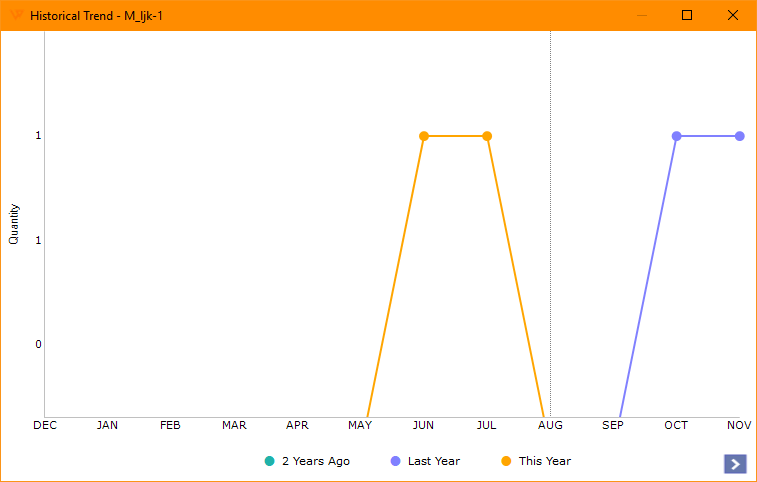
Historical Trend: Clicking this icon will display a graph showing up to three years of sales for a specific SKU.
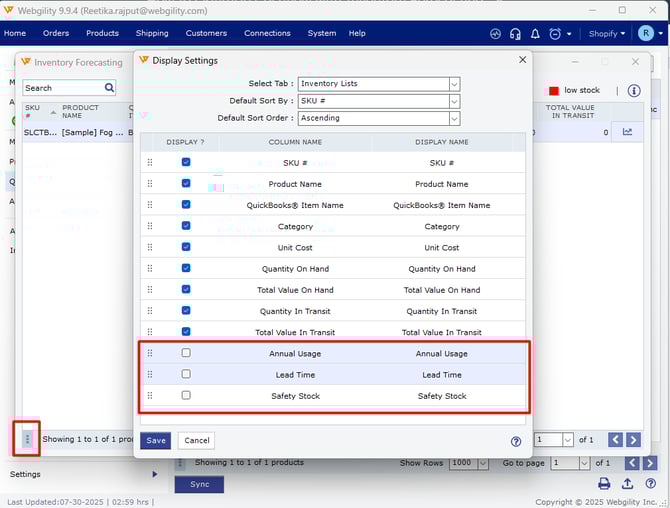
4. Additionally, there are other columns that can be displayed by clicking the display settings in the lower left. Clicking the box to the left will allow these additional columns to display within the List Inventory view.
Here, you'll see the following:
-
Annual Usage: The total number of units sold in the previous 365 days.
-
Lead Time: The number of days you have defined to receive more inventory.
-
Safety Stock: The suggested inventory amount to reorder the SKU without running out or overstocking.
Adjusting Settings
1. To adjust the Inventory Forecasting settings, go to the menu bar and select Products > Settings > Forecasting Settings.
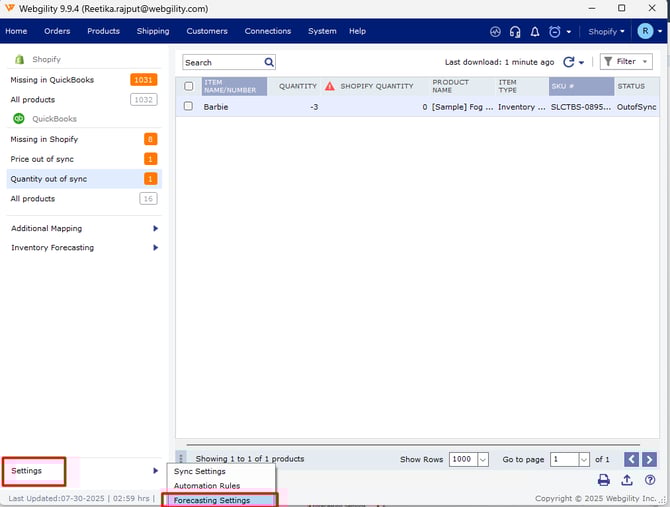
2. In the pop-up screen, navigate to Forecast Settings.
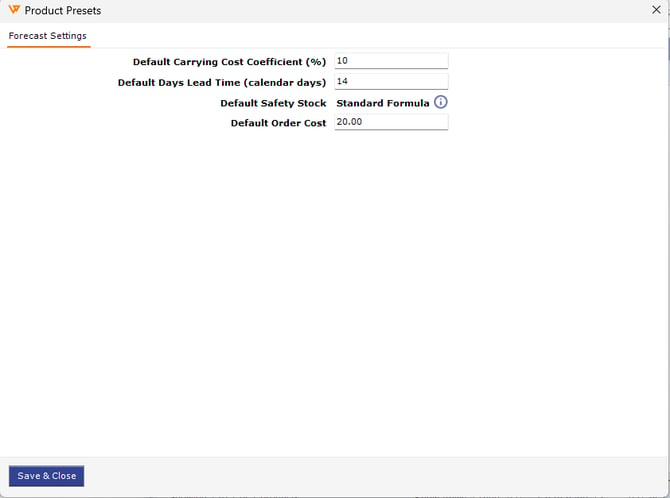
Here, you will see the following:
-
Default Carrying Cost Coefficient (%): The cost to store the product in your warehouse. The default value is 10%.
-
Default Days Lead time (calendar days): The number of days after an order is placed for a product that it takes to receive it into inventory. The default value is 14 days.
-
Default Safety Stock:This equation calculates the stock level an item needs to be at for you to place an order for more units. 1.65 X (lead time)^.5. This is not editable by default. To adjust this calculation, chat with our customer success team right here.
-
Default Order Cost: This is the cost of reordering your items, not the cost of the items themselves. The default value is 20.00.
Adjust Supply Levels
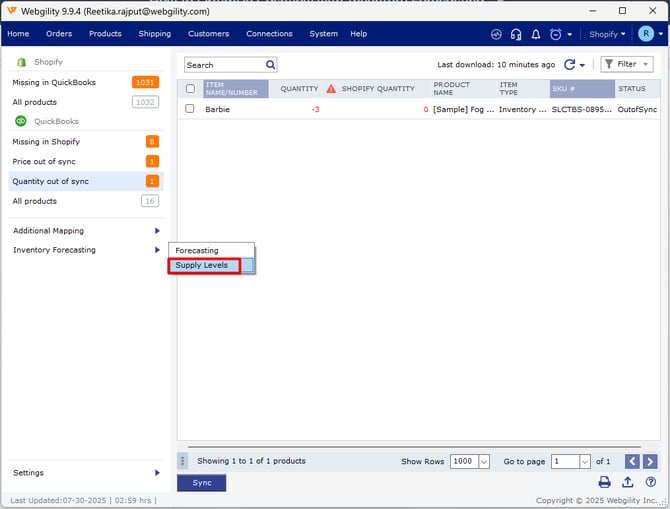
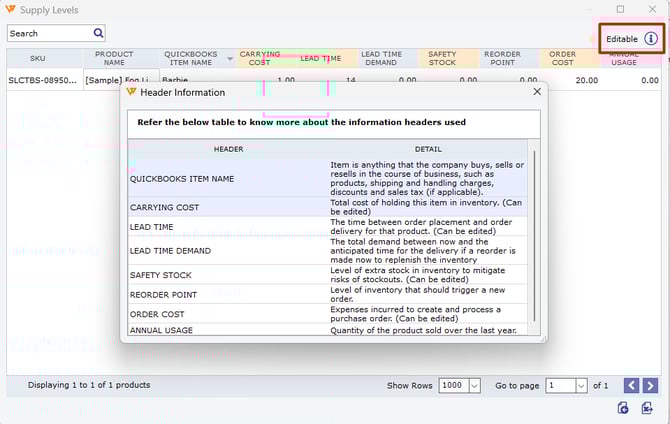
1. To adjust your default supply levels, go to Products > Inventory Forecasting > Supply Levels.
2. This will bring you to Supply Levels. Here, you can edit products individually or import a new .csv to adjust products in bulk.
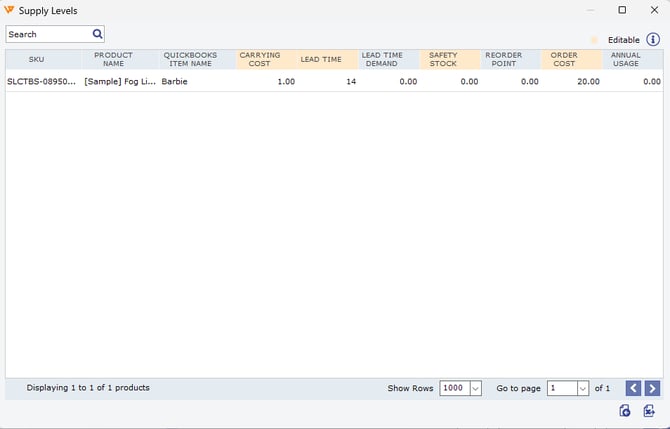
3. Columns with an orange header are editable. The remaining are calculated or are static values.
4. You can bulk edit the items here by clicking Export. This will create a .csv template. Use the .csv in a spreadsheet editor to modify the values, then import to overwrite the existing values.